
SDoH in Queer Hotspots and Coldspots – The Medical Care Blog
Happy Pride month! In this post, I’d like to share about a research project in progress that is relevant to the LGBTQ+ community. This post may also be interesting to those of you who care about health equity and the social determinants of health (SDoH).
Throughout, I use the term “queer people” as an umbrella term for members of the LGBTQ+ community. Terminology is always evolving. I welcome comments from members of the community who have alternative terms to suggest.
I am a member of the queer community myself. I’ve always shied away from research in the LGBTQ+ area, in part because science requires impartiality. It’s hard to be impartial about issues that concern my own identity. Yet, I am attempting it now.
Measures and Data
Over the past few years, I’ve been honored to lead an award-winning, multi-disciplinary team of researchers in exploring data science for health equity. We have curated a huge database of community-level SDoH measures. One of them, in our “Bias, Stress, and Trauma” domain, is percent of households containing same-sex partners.
This measure comes from the Census. The data, which they have collected since the 90s, provides the only national data on where queer couples live. We have no national data on where single queer people live.
From the Census measure of same-sex partners, using the American Community Survey estimates pooled across 5 years (2010-14), we constructed two groups of neighborhoods (defined as Census tracts):
- Neighborhoods in the highest (99th) percentile of same-sex partners in 2010-14 (“queer hotspots”)
- This corresponds to 3.7% or more
- Neighborhoods with 0 same-sex partners in 2010-14 (“queer coldspots”)
- Note that there may have been queer people in those tracts who were either single or not otherwise identified by the Census
Health Promoting Factors
The literature is virtually silent on the topic of SDoH in queer hotspots.
One of the few examinations of SDoH in “gayborhoods” was published in a book chapter in 2021 and makes for interesting reading. One of the points the authors make is that, as in ethnic enclaves (such as “Little Italy”-type neighborhoods),
“residential areas with relatively large concentrations of sexual minorities can be understood as places where marginalized people find resources, including protection from discrimination, a sense of community, shared values, and opportunities for social support.”
In other words, living in neighborhoods where the welcome mat is out can be health-promoting.
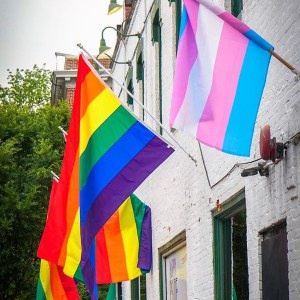
In historic “gayborhoods,” this may take the form of rainbow flags in store windows and outside homes. Additionally, seeing queer people holding hands and otherwise being visibly out can be affirming.
Historical Gayborhoods vs. Queer Hotspots
While plenty of publications have focused on “gayborhoods”, these are often defined by the presence of queer business establishments, rather than queer residents.
We take a slightly different approach by focusing on neighborhoods where same-sex couples cluster. These “queer hotspots” are in the 99th percentile of the distribution of same-sex couple households (as a percent of total households) across 72,057 Census tracts for which data were available.
Mapping the Hotspots and Coldspots
In the map below, we show the percent of neighborhoods in each state that were queer hotspots.
As of 2010-14, 720 Census tracts contained 3.7% or more same-sex couples. In addition, 23 neighborhoods had more than 10% same-sex couples.
Some of these outlier tracts were in well-known historic gayborhoods, including the Castro in San Francisco and West Hollywood in Los Angeles.
Others are not on any map of well-known gayborhoods.
For example, some of the outlier tracts were in Texas, Ohio, South Carolina, and Arizona.
More than 4% of Delaware’s 218 tracts qualified as queer hotspots, mostly clustered in and around Rehoboth Beach – a town of fewer than 2,000 people.
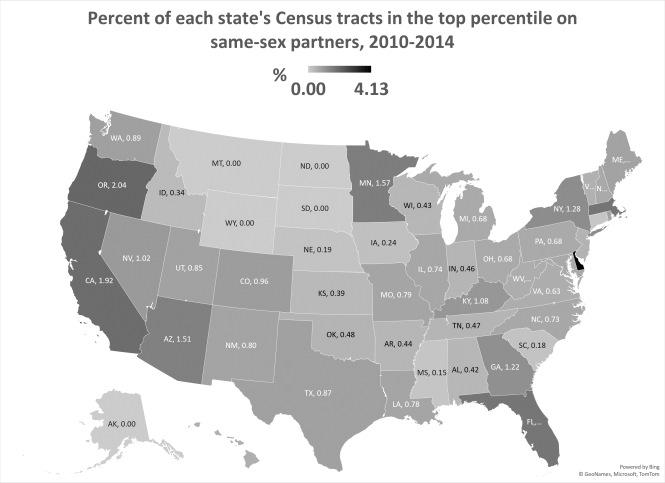 Five states had no queer hotspots at all. In fact, 56.4% of US Census tracts contained 0 same-sex couples according to the 2010-14 Census data.
Digging into the Social Determinants
According to the CDC’s USALEEP project, life expectancy at birth in queer hotspots is slightly longer than in queer coldspots: 78.7 years vs. 78.0 years, respectively.
This could, perhaps, be a function of the effects of educational attainment. In the queer hotspots, 11% of adults over 25 years had less than a high-school diploma. In queer coldspots, 16% had less than a high-school education.
Similarly, in queer hotspots, 43% of residents had a bachelor’s degree or higher, compared with only 26% in queer coldspots.
Being a member of a sexual minority is traditionally thought to be a risk factor for mental health concerns. Interestingly, fewer people in the queer hotspots report 2+ weeks of mentally unhealthy days in the past month (13%) compared to queer coldspots (15%).
Perhaps this is confounded by other characteristics of these neighborhoods. Future analyses are clearly needed to untangle the interactions. Alternatively, it may be a signal of the previously established protective effects of the virtual welcome mat.
In terms of community health, fewer queer hotspot residents are obese (28% vs. 33%) or sedentary (21% vs. 27%) than in queer coldspots. Smoking rates are also lower in queer hotspots (16%) than in coldspots (19%).
Health Risks in the Queer Hotspots
A few of the SDoH seem worse in queer hotspots. Specifically, only 78% of students in queer hotspots graduated from high school in 4 years, compared to 81% in queer coldspots. Queer hotspots have higher rates of excessive drinking and HIV (and other STIs, such as chlamydia).
Poverty rates were very similar in both types of communities (roughly 15-16%), but owner-occupied home values were much higher in queer hotspots (mean = $340,261) compared to queer coldspots ($204,441).
Homeownership rates, on the other hand, are much lower in queer hotspots (53%) than in coldspots (64%).
More to Come
We hope you’ve enjoyed getting a peek at these preliminary, descriptive results. Like any other characteristic, sexual orientation is just one aspect of a person’s identity. Many other factors go into the health of a community. At the same time, it’s interesting to learn more about the social determinants in places where same-sex couples cluster and where they are absent. Perhaps these insights will serve to remind us that stereotypes are not helpful, but data can help.