Price transparency data provides new visibility into real rates paid to providers
Editor’s note: JoAnna Younts is manager director at consultancy firm Berkeley Research Group and Konstantin Gorelik is a consultant for the company.
Prices for healthcare services, unlike prices for other services in the U.S. economy, have historically been considered proprietary, and consumers and other stakeholders generally have been denied access to them. In addition, differences in prices for the same service across hospitals and other types of healthcare providers have left many consumers with bills that they don’t understand and/or can’t afford.
Incorporated into the Consolidated Appropriations Act passed by Congress in 2020 and described in detail in subsequent interim final rules, price transparency requirements have been promulgated since 2018. Price transparency in healthcare attempts to identify costs to providers, insurers and consumers, particularly individuals needing specific types of healthcare services. The primary goals of these transparency requirements are to provide consumers more information, allowing for more informed healthcare decisions, and to encourage competition in the healthcare marketplace, ultimately resulting in lower healthcare costs.
Hospital price transparency
Price transparency requirements began with the rules requiring that hospitals publish their chargemasters. CMS’ final rule issued in August 2018 required hospitals “… to establish and make public a list of their standard charges.”
The federal Hospital Price Transparency Rule went into effect on Jan. 1, 2021. The rule requires hospitals to post a machine-readable file containing charges, discounted cash prices and payer negotiated rates/prices, among other things, for all items and services; and a consumer-friendly display of the same information for at least 300 “shoppable” services.
Initially, hospital compliance with the rule was low. Although compliance has improved, a 2022 study found that just two of 361 hospitals owned by the three largest hospital systems in the U.S. were compliant. In an attempt to improve compliance, the CMS increased the penalty to up to $5,500 per day.
BRG Health Analytics professionals have organized and analyzed the transparency data across the United States and in specific markets over the past year. To evaluate the state of compliance as of March 1, 2022, BRG analyzed 6,710 hospitals for which published rates were available. Fifty-eight percent of these hospitals (3,927) complied with the requirement to publish data on 300 unique services. However, BRG identified only 1.8% of hospitals as being in “true compliance,” defined as a hospital having provided data for both the 70 CMS required shoppable services and at least 300 unique services.
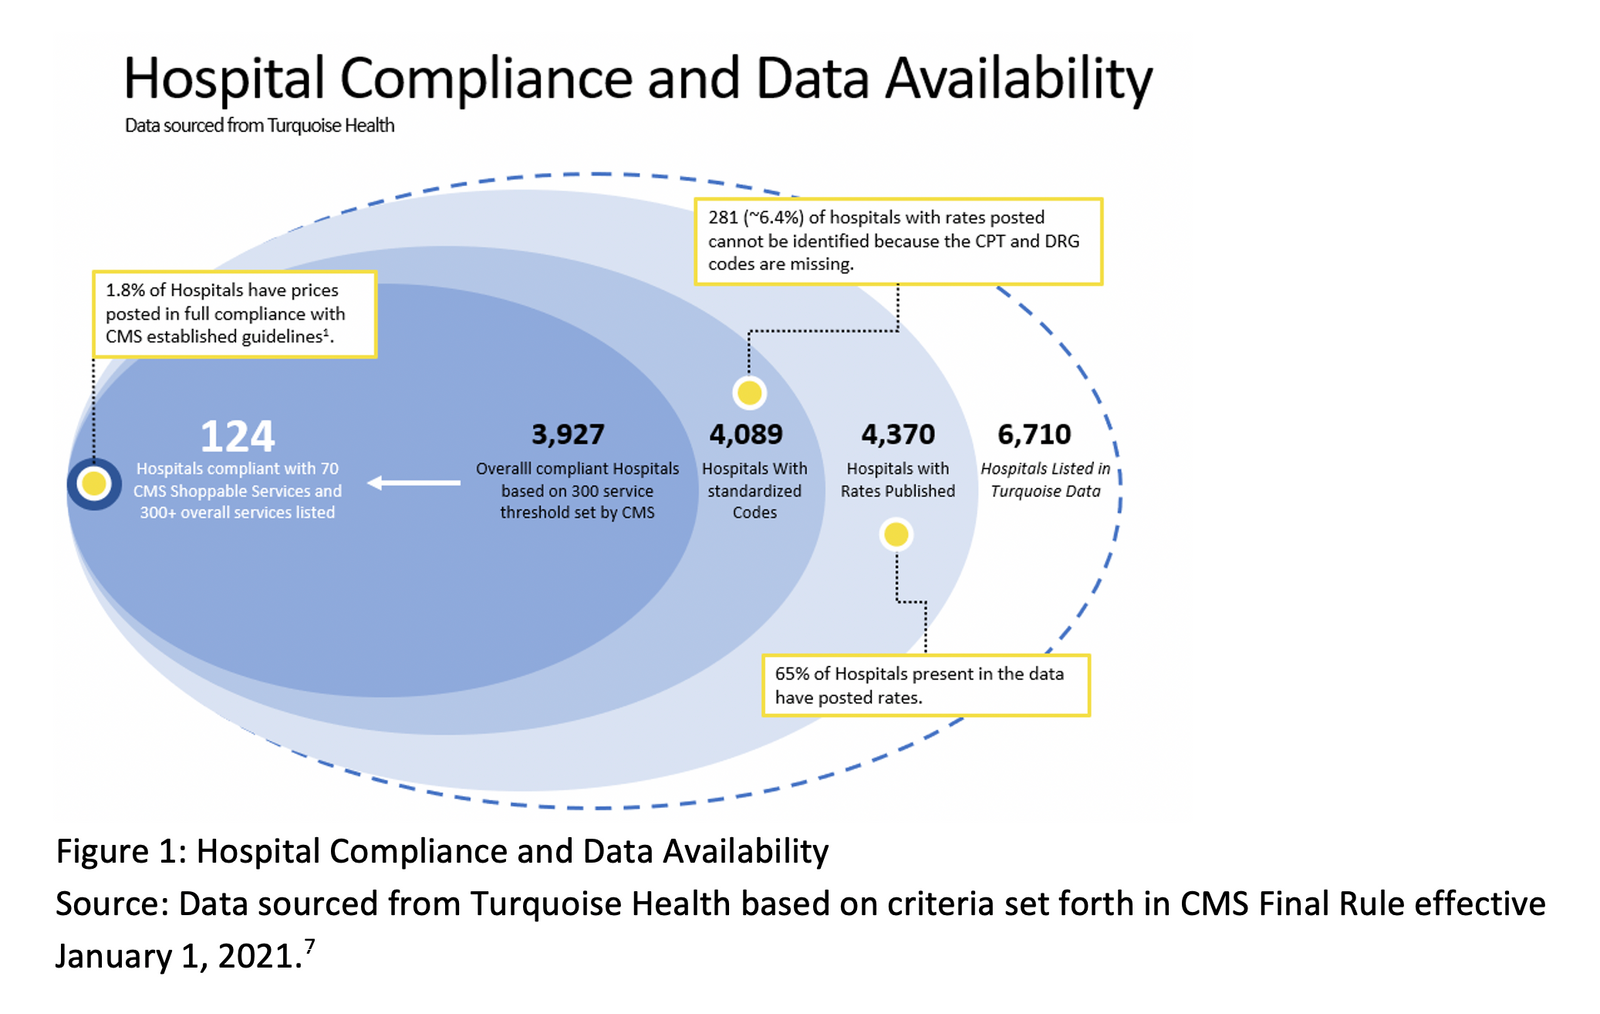
Permission granted by BRG
Payer price transparency
The CMS’ Transparency in Coverage Rule, also within the CAA, will be phased in over the next few years. Most health plans are non-grandfathered. Similar to hospitals, as of July 1, 2022, health plans were required to make available machine-readable files that are updated monthly and contain in-network rates as well as out-of-network allowed amounts.
As of Jan. 1, 2023, plans must provide price comparison information for 500 items and services identified by the CMS through an internet-based self-service tool; and as of Jan. 1, 2024, the tool must include prescription drug prices as well.
Use cases for transparency data
Payers can use hospital transparency data to gain insights regarding the rates hospitals have negotiated with other payers, which potentially can be used during contract negotiations. For example, payers can evaluate the negotiated rates for specific hospitals compared to their competitor health plans to gauge alignment with their proposed rates and discounts. This is illustrated in Figure 2, which shows the average negotiated rates for a CT scan of the abdomen (CPT 74177) for each payer who contracts with Loyola University Medical Center near Chicago, compared to the hospital’s standard billed charge for the procedure. As shown in the graph, the average negotiated rate as a percentage of billed charges (list price) ranges from 3% to 24% (about $200 to $1,800).
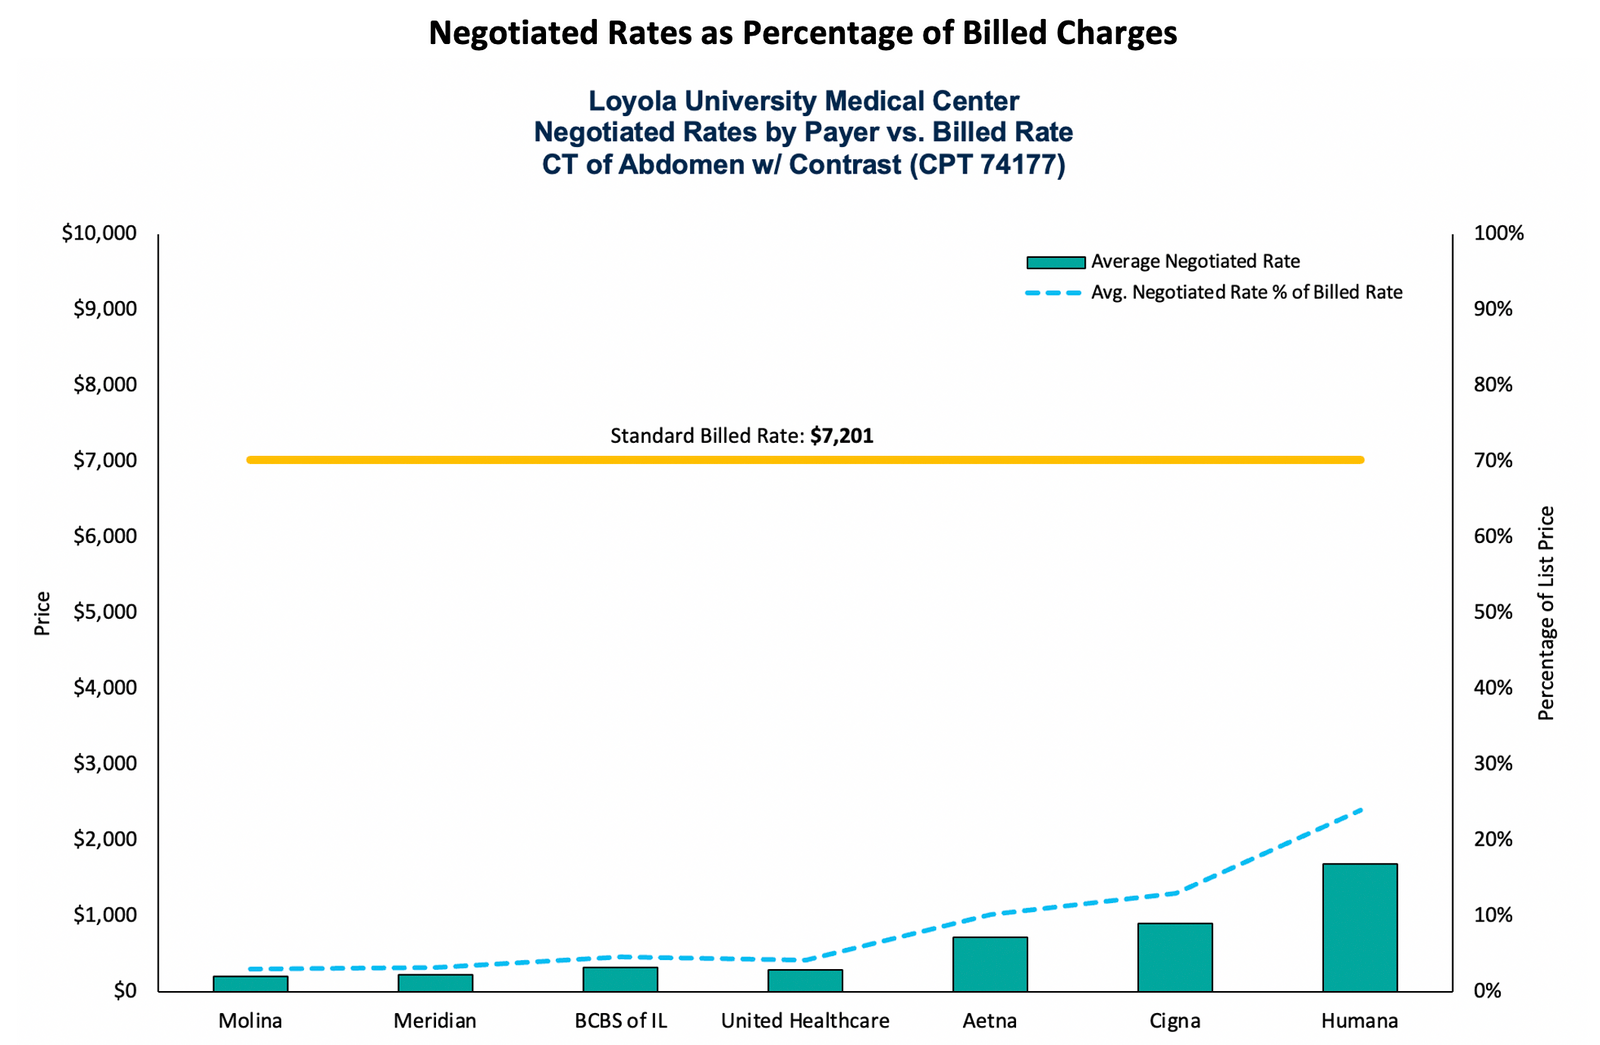
Permission granted by BRG
Data also can be aggregated for geographic markets, as shown in the graphs, which shows the average negotiated rate across all payers for the same CT scan for all hospitals in the Chicago area. While the billed charge amounts vary dramatically across hospitals (from $567 to $12,690), the negotiated rates also range from $338 to $6,182.
Permission granted by BRG
Similar analyses can be conducted for inpatient services. The figure below shows the average negotiated rate for each payer contracted with Rush University Medical Center for a common diagnosis-related group (DRG) (291 – heart failure and shock) compared to the hospital’s billed charge amount for this DRG. The discount obtained from United Healthcare is 58% compared to Blue Cross at 42%.
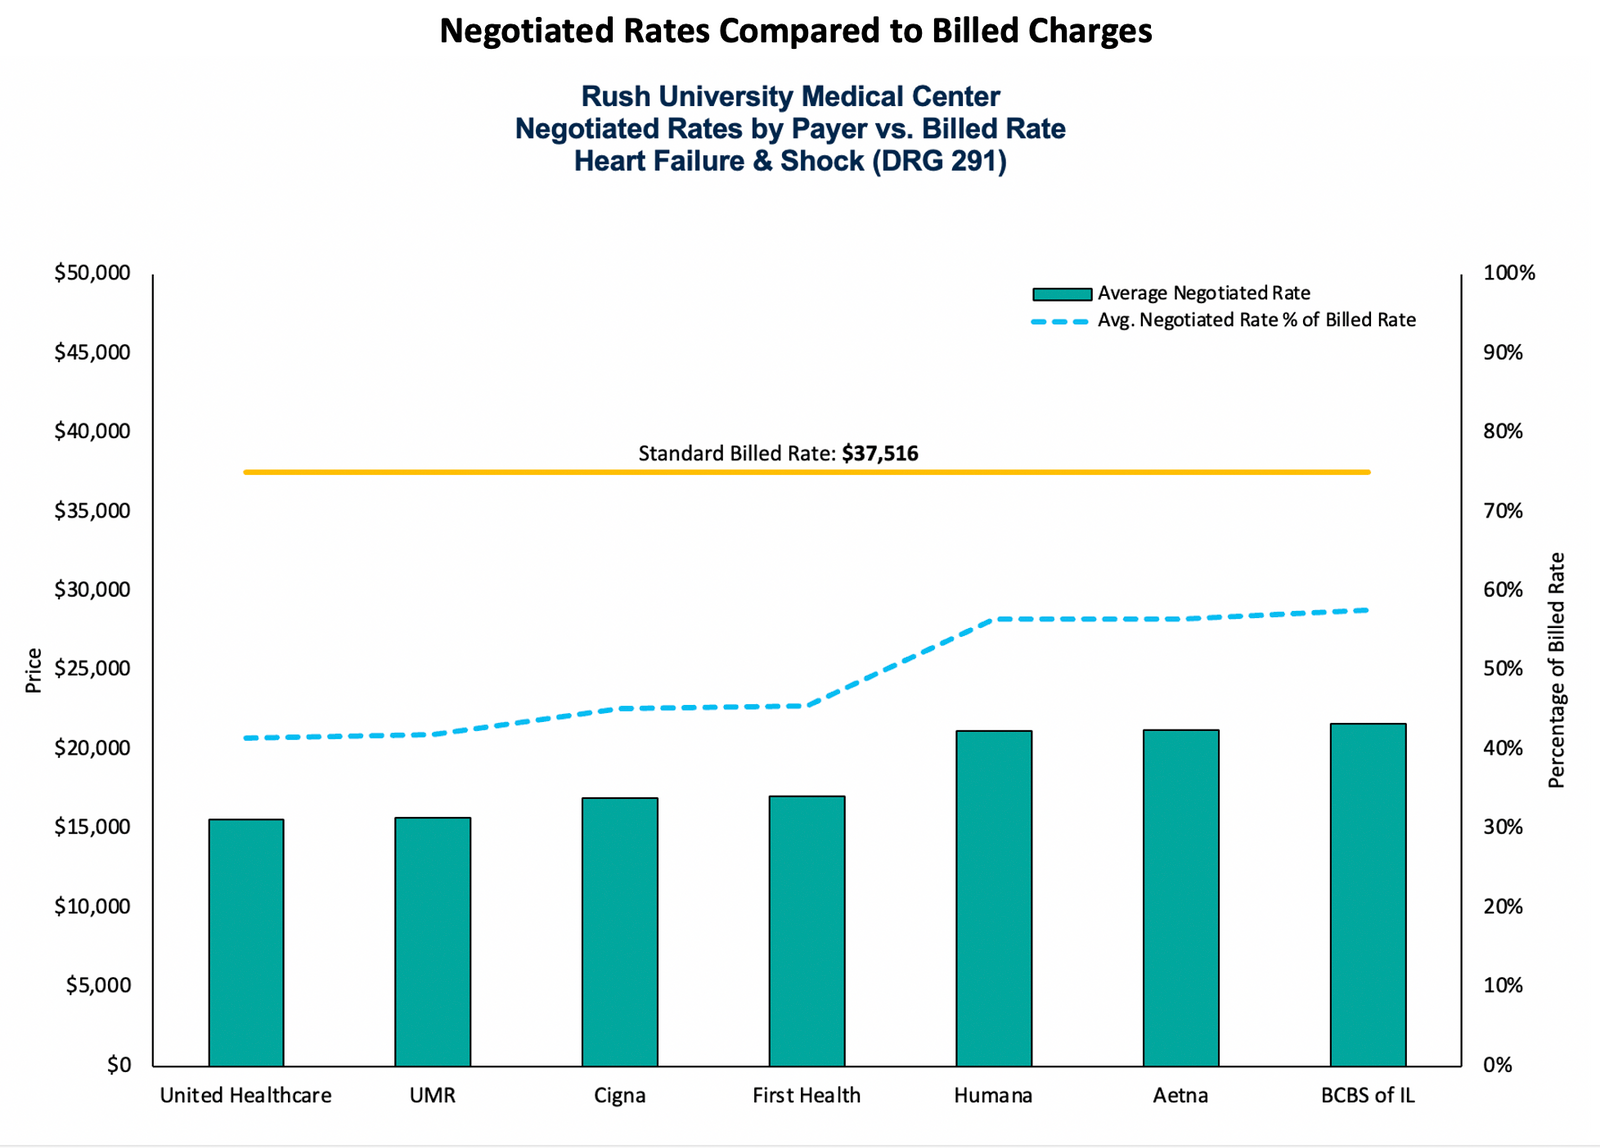
Optional Caption
Permission granted by BRG
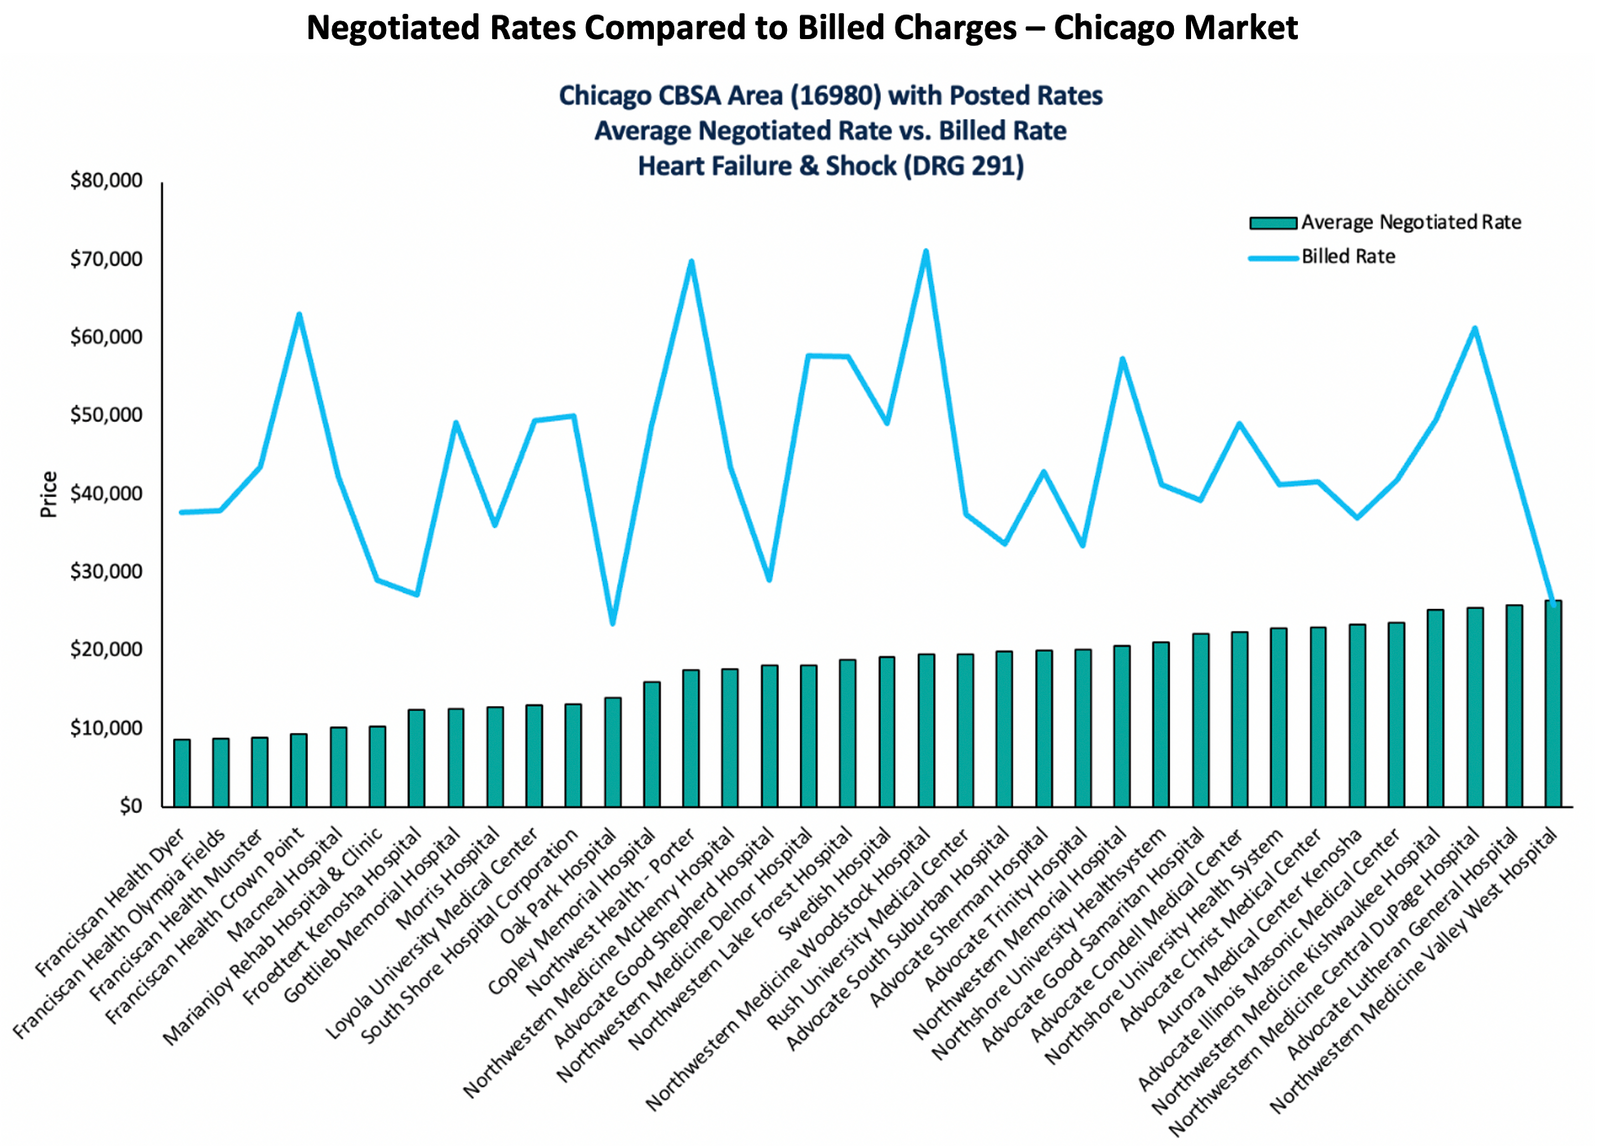
Analysis of the data for the same DRG again can be aggregated for specific geographic markets, as shown in the figure below, which shows the average negotiated rate across all payers for DRG 291 (heart failure and shock) for all hospitals in the Chicago area. Here, billed charge amounts range from $23,458 to $71,208 across hospitals, while negotiated rates range from $8,675 to $26,468.

Permission granted by BRG
Another use of the data, which is in alignment with the rule’s primary intent, is consumer education. Payers have an opportunity to use the data to provide cost estimates to their members prior to accessing care. Because members now can better understand a hospital’s negotiated rates with their specific insurance plans, they have the ability to independently and proactively plan for at least some of their medical expenses, and payers can integrate these costs with their members’ specific claims accumulators to compute the member’s out-of-pocket payments for specific services.
The below figure illustrates how a member can use the data to view the average negotiated rate for different hospitals for their plan (in this case, Aetna) in the San Francisco area, which may help them determine where they would like to receive a specific service. While some individuals may use the hospital where their surgeon has admitting privileges or has recommended, some may find the data useful as they begin the process and potentially identify particular hospitals first.
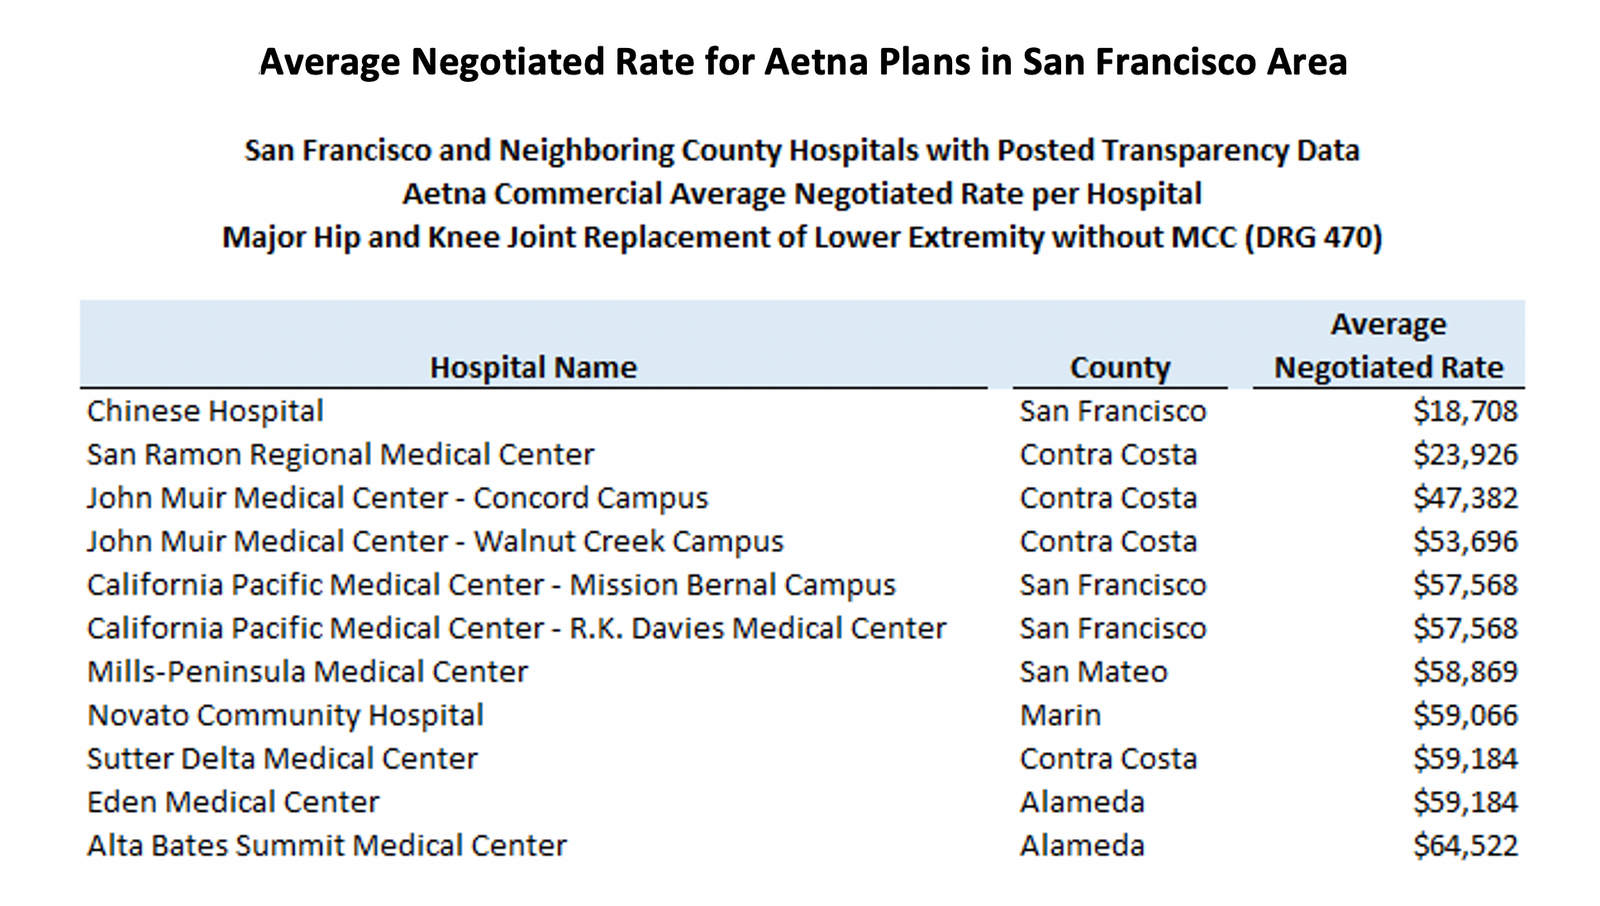
Permission granted by BRG
The increased accessibility of this type of data has the potential to drive down operational costs, if members actually use the data. On the one hand, members would not need to rely completely on payer customer service to obtain cost information; on the other hand, payers also may need to provide members with information about how to use the data on their own. If consumer use becomes more widespread, plans may be able to lower their administrative costs — and potentially claims costs if members consistently select lower-cost options.
Finally, as shown in the figure below, researchers also can use the data to compare the costs of healthcare services across different areas of the U.S. An analysis by state and Core Based Statistical Area for an MRI of a lower body extremity (CPT 72721), which is a standard shoppable procedure, can identify the most and least expensive markets in the U.S. for specific services.
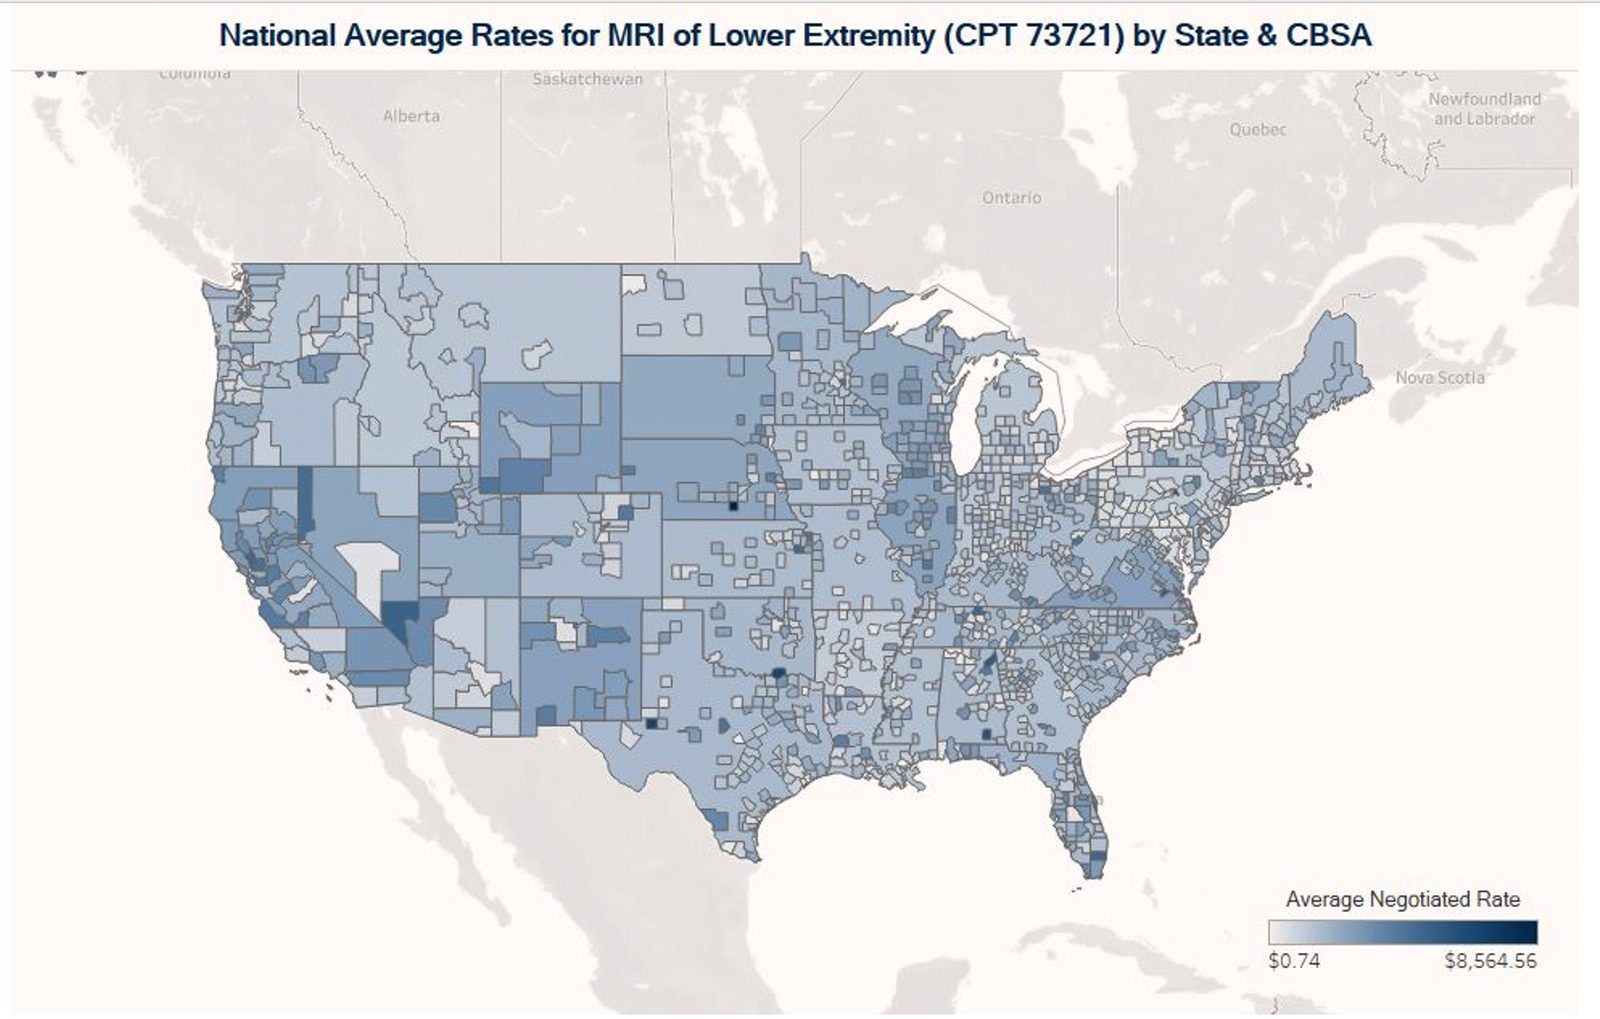
Permission granted by BRG
Both the hospital and payer transparency data have tremendous potential to provide new, previously unavailable information to various stakeholders. The hospital transparency data, while variable in completeness across different markets, provides valuable comparisons of negotiated rates across hospitals and health plans in the same markets, as well as comparisons to billed charges. The payer transparency data will provide new visibility into rates for provider types such as physicians and other professional providers that was not previously available.
These data will prove valuable in contract negotiations and may come into play in disputes and investigations. As analysis of the data becomes more widespread, consumers will be able to take better advantage of the information as well.
Editor’s note: The views and opinions expressed in this article are those of the author and do not necessarily reflect the opinions, position, or policy of Berkeley Research Group, LLC or its other employees and affiliates.